Platform
ReservoirIQ
The valuation infrastructure behind Cervus' evaluation desk. Every Canadian upstream asset, every public Canadian E&P, modeled bottom-up against multiple price decks and fiscal regimes.
Engage Cervus to access ReservoirIQ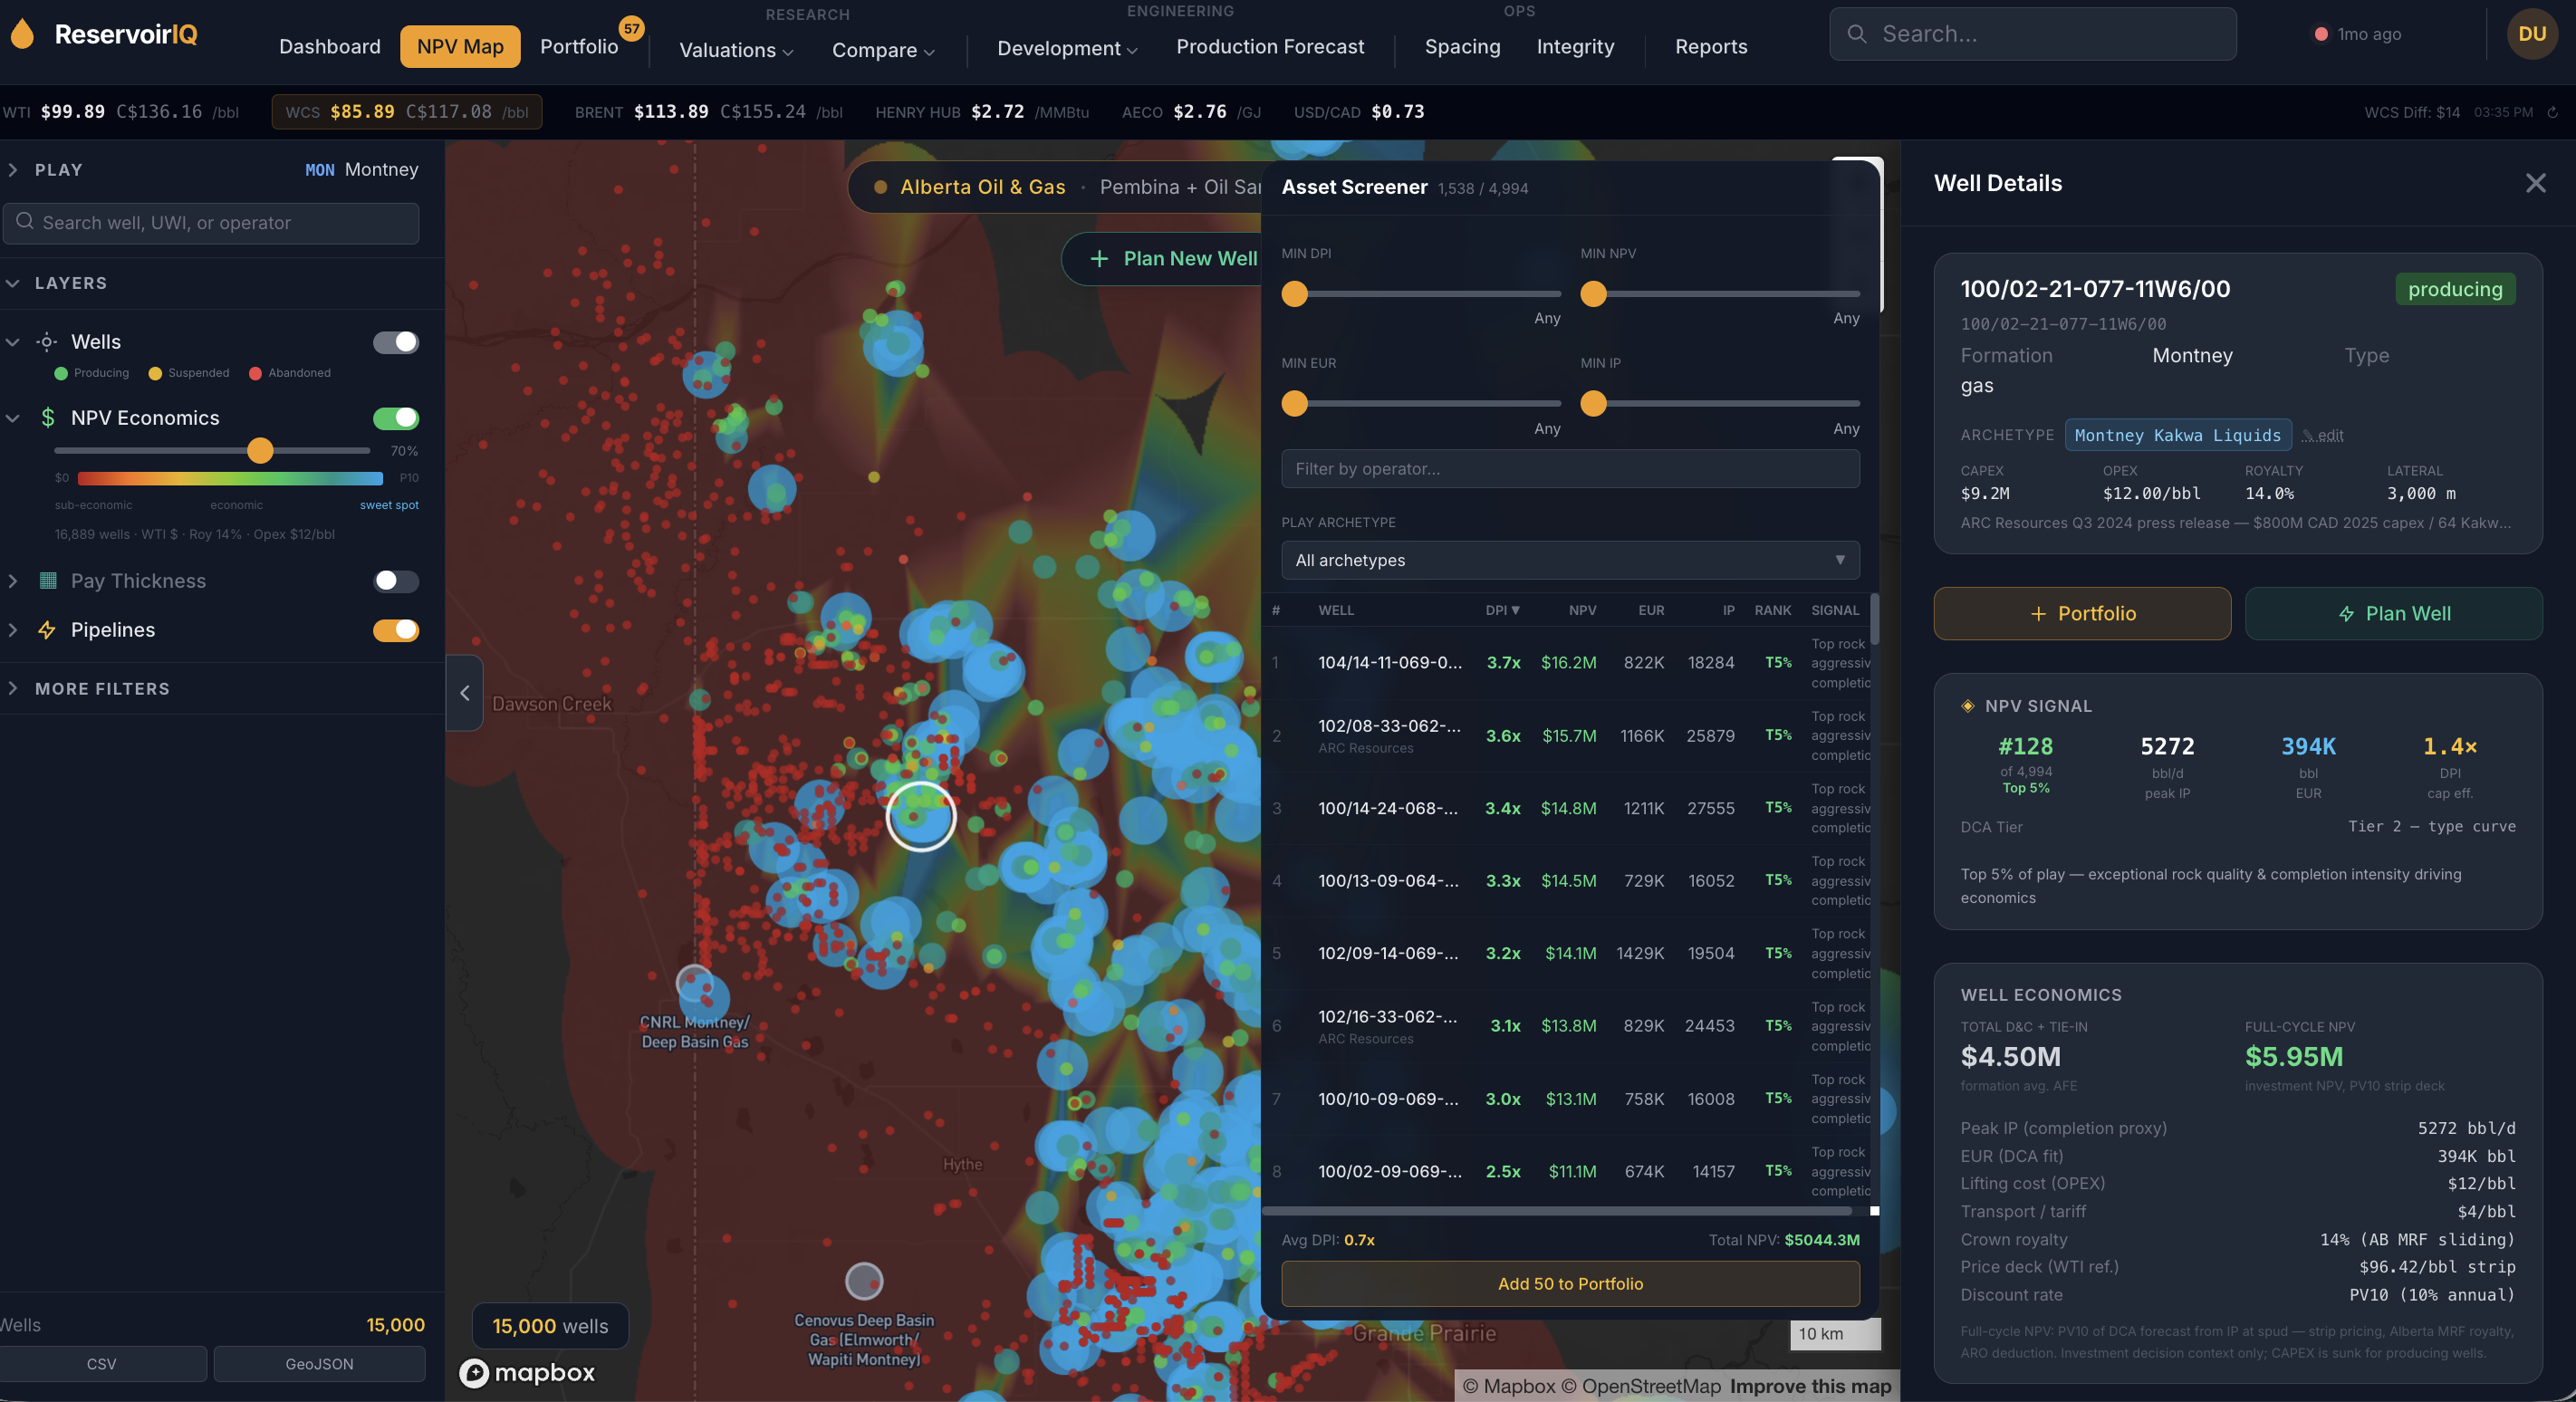
Platform
The valuation infrastructure behind Cervus' evaluation desk. Every Canadian upstream asset, every public Canadian E&P, modeled bottom-up against multiple price decks and fiscal regimes.
Engage Cervus to access ReservoirIQWells modeled bottom-up across Alberta and Saskatchewan
Public Canadian E&P operators with full equity-NAV waterfall
Editable variables per thermal facility in our scenario workbench
What ReservoirIQ does
ReservoirIQ is the bottom-up upstream model we built to deliver evaluation work at the speed and depth our clients need. It models every Alberta and Saskatchewan well, every public Canadian E&P operator, the major thermal facilities, the East Coast offshore fields, and the integrated downstream chain. Every number is built from public production data, regulatory filings, and reserve-evaluator methodology, and every assumption is editable.
ReservoirIQ runs inside an engagement. The platform is the desk, and the desk is the engagement. Your team accesses operator and asset views during an active retainer.
Capabilities
DCA fits on 5,533 anchor wells across Arps and Duong methodology. Type-curve scaling for 183K additional wells via formation, field, and drill-type peer groups. Per-well NPV, DPI, and EUR cached for sub-second screening. Thirty-eight play archetypes from Montney Kakwa Liquids to Clearwater Multilateral to Cardium Pembina.
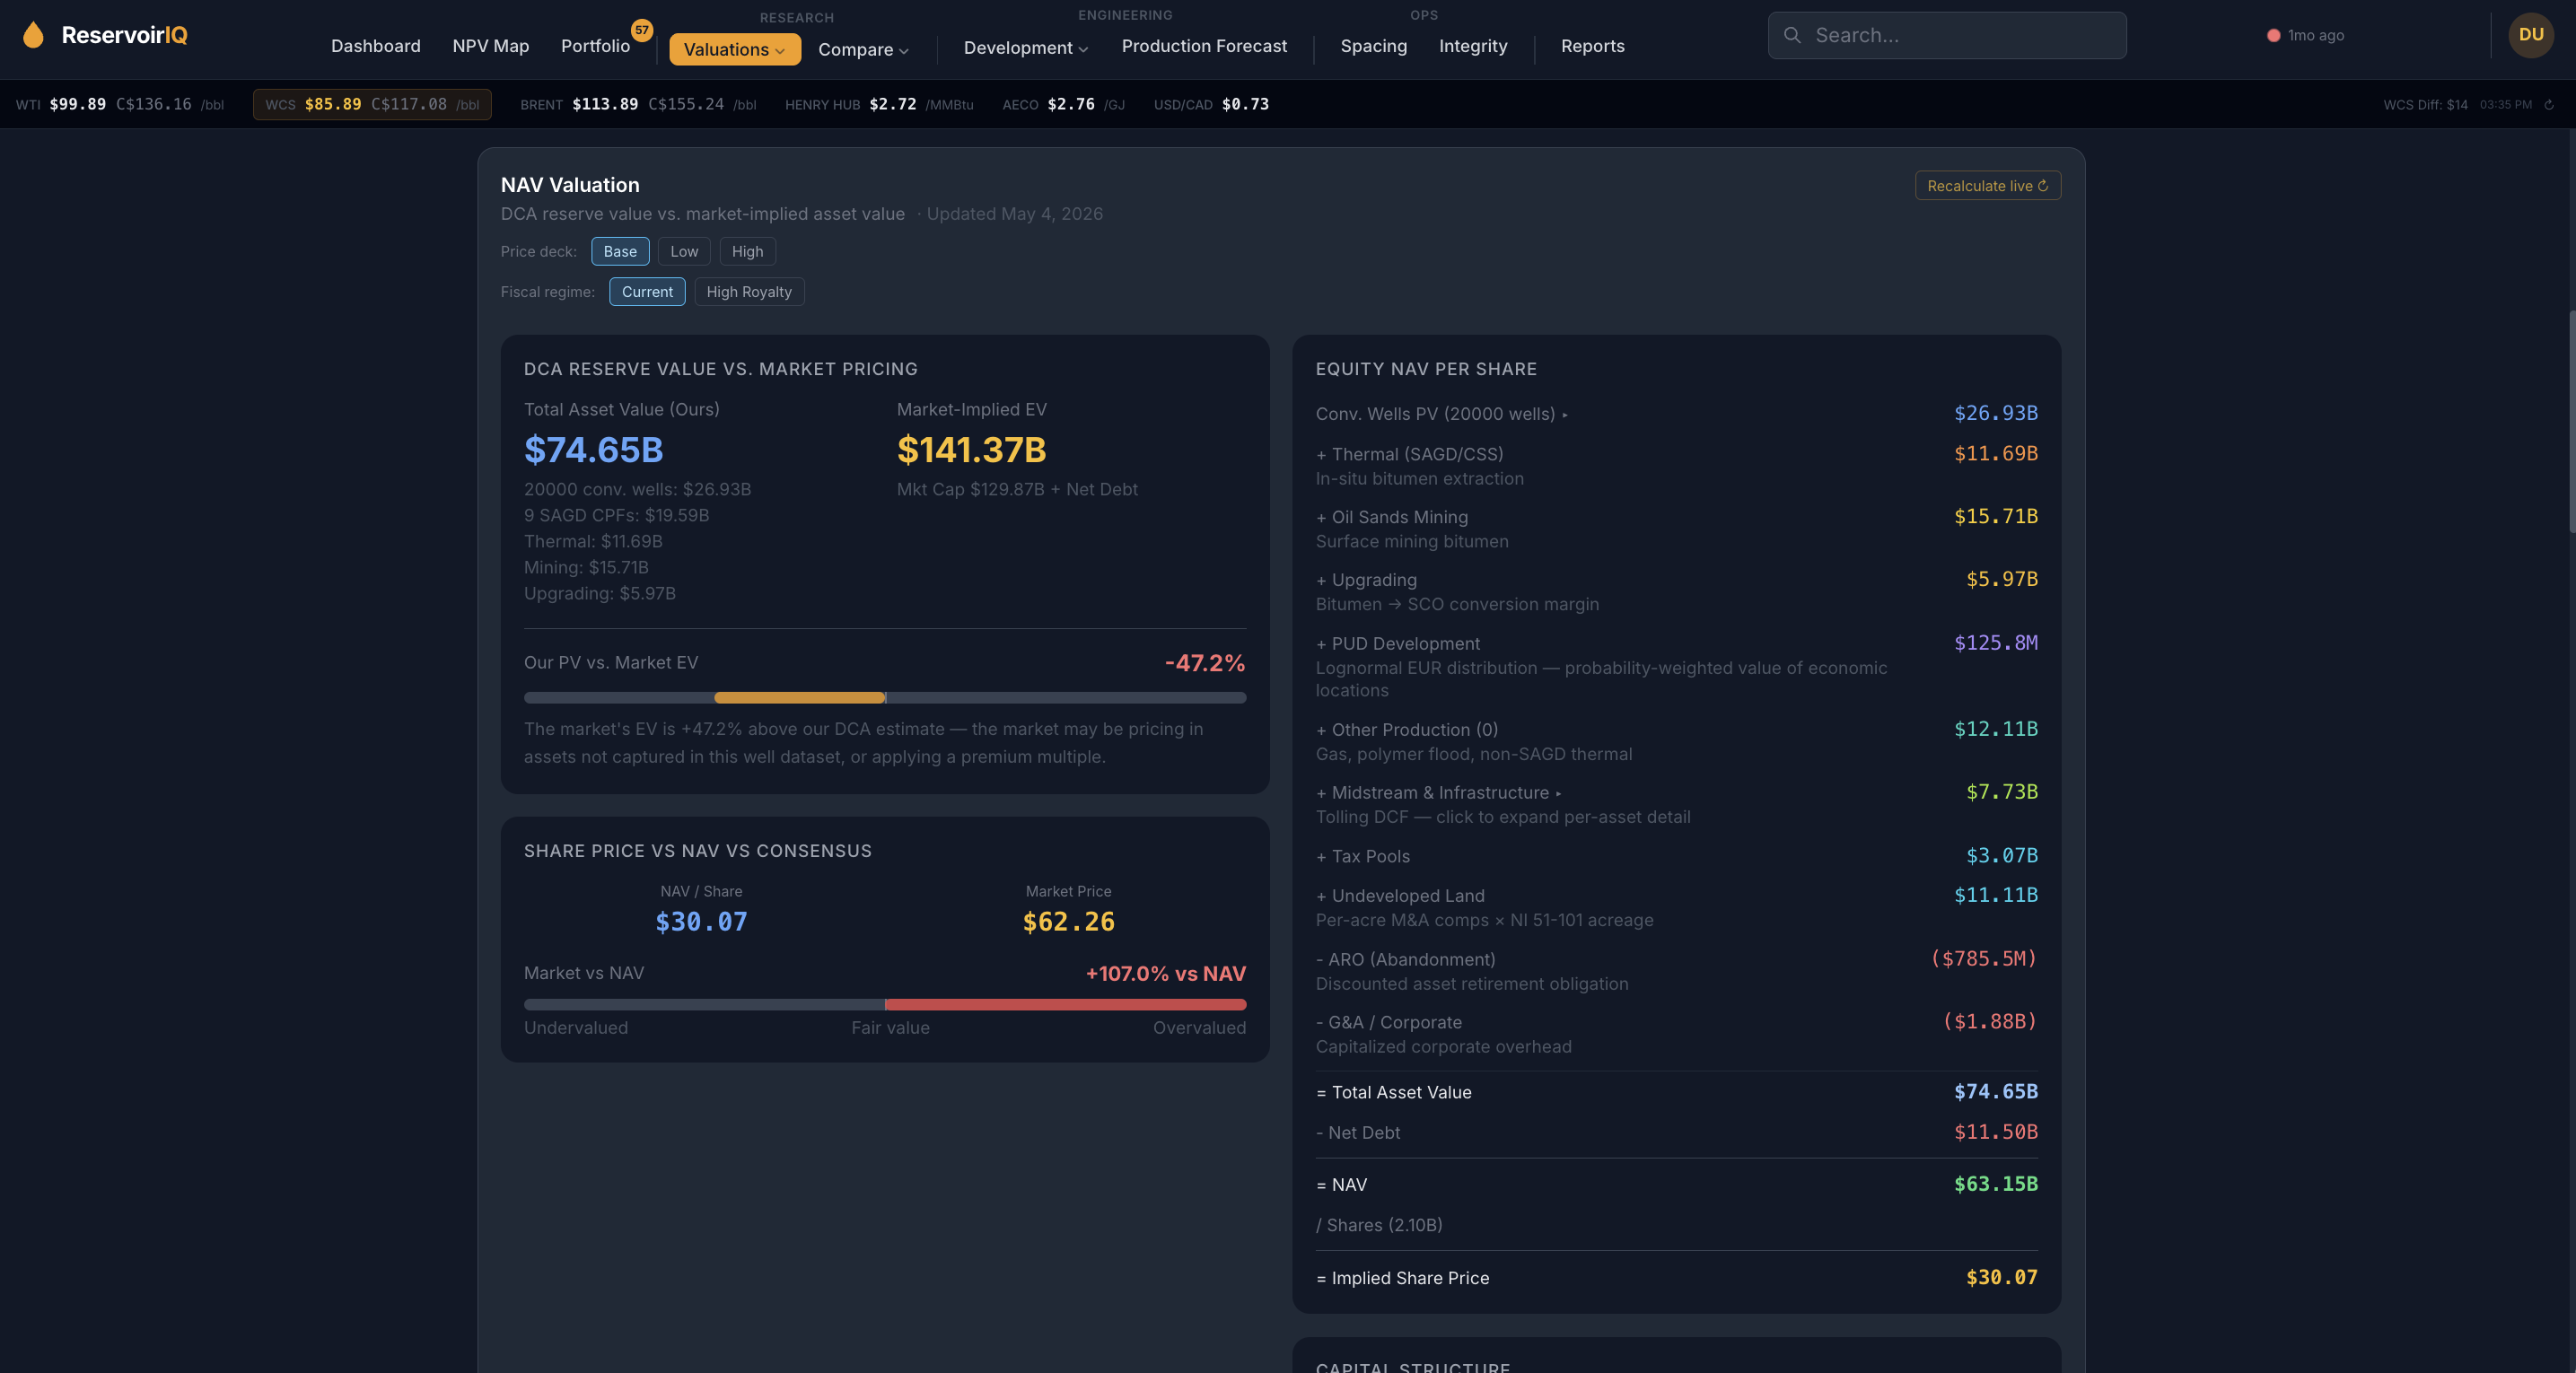
Bottom-up NAV waterfall for every public Canadian E&P. Conventional, SAGD, mining, upgrader, downstream, offshore, midstream, land value, debt, ARO. All post-tax under combined federal and provincial rates, with CCA Class 10 declining-balance, half-year rule, and loss carryforward. Reconciled live against TSX market cap.
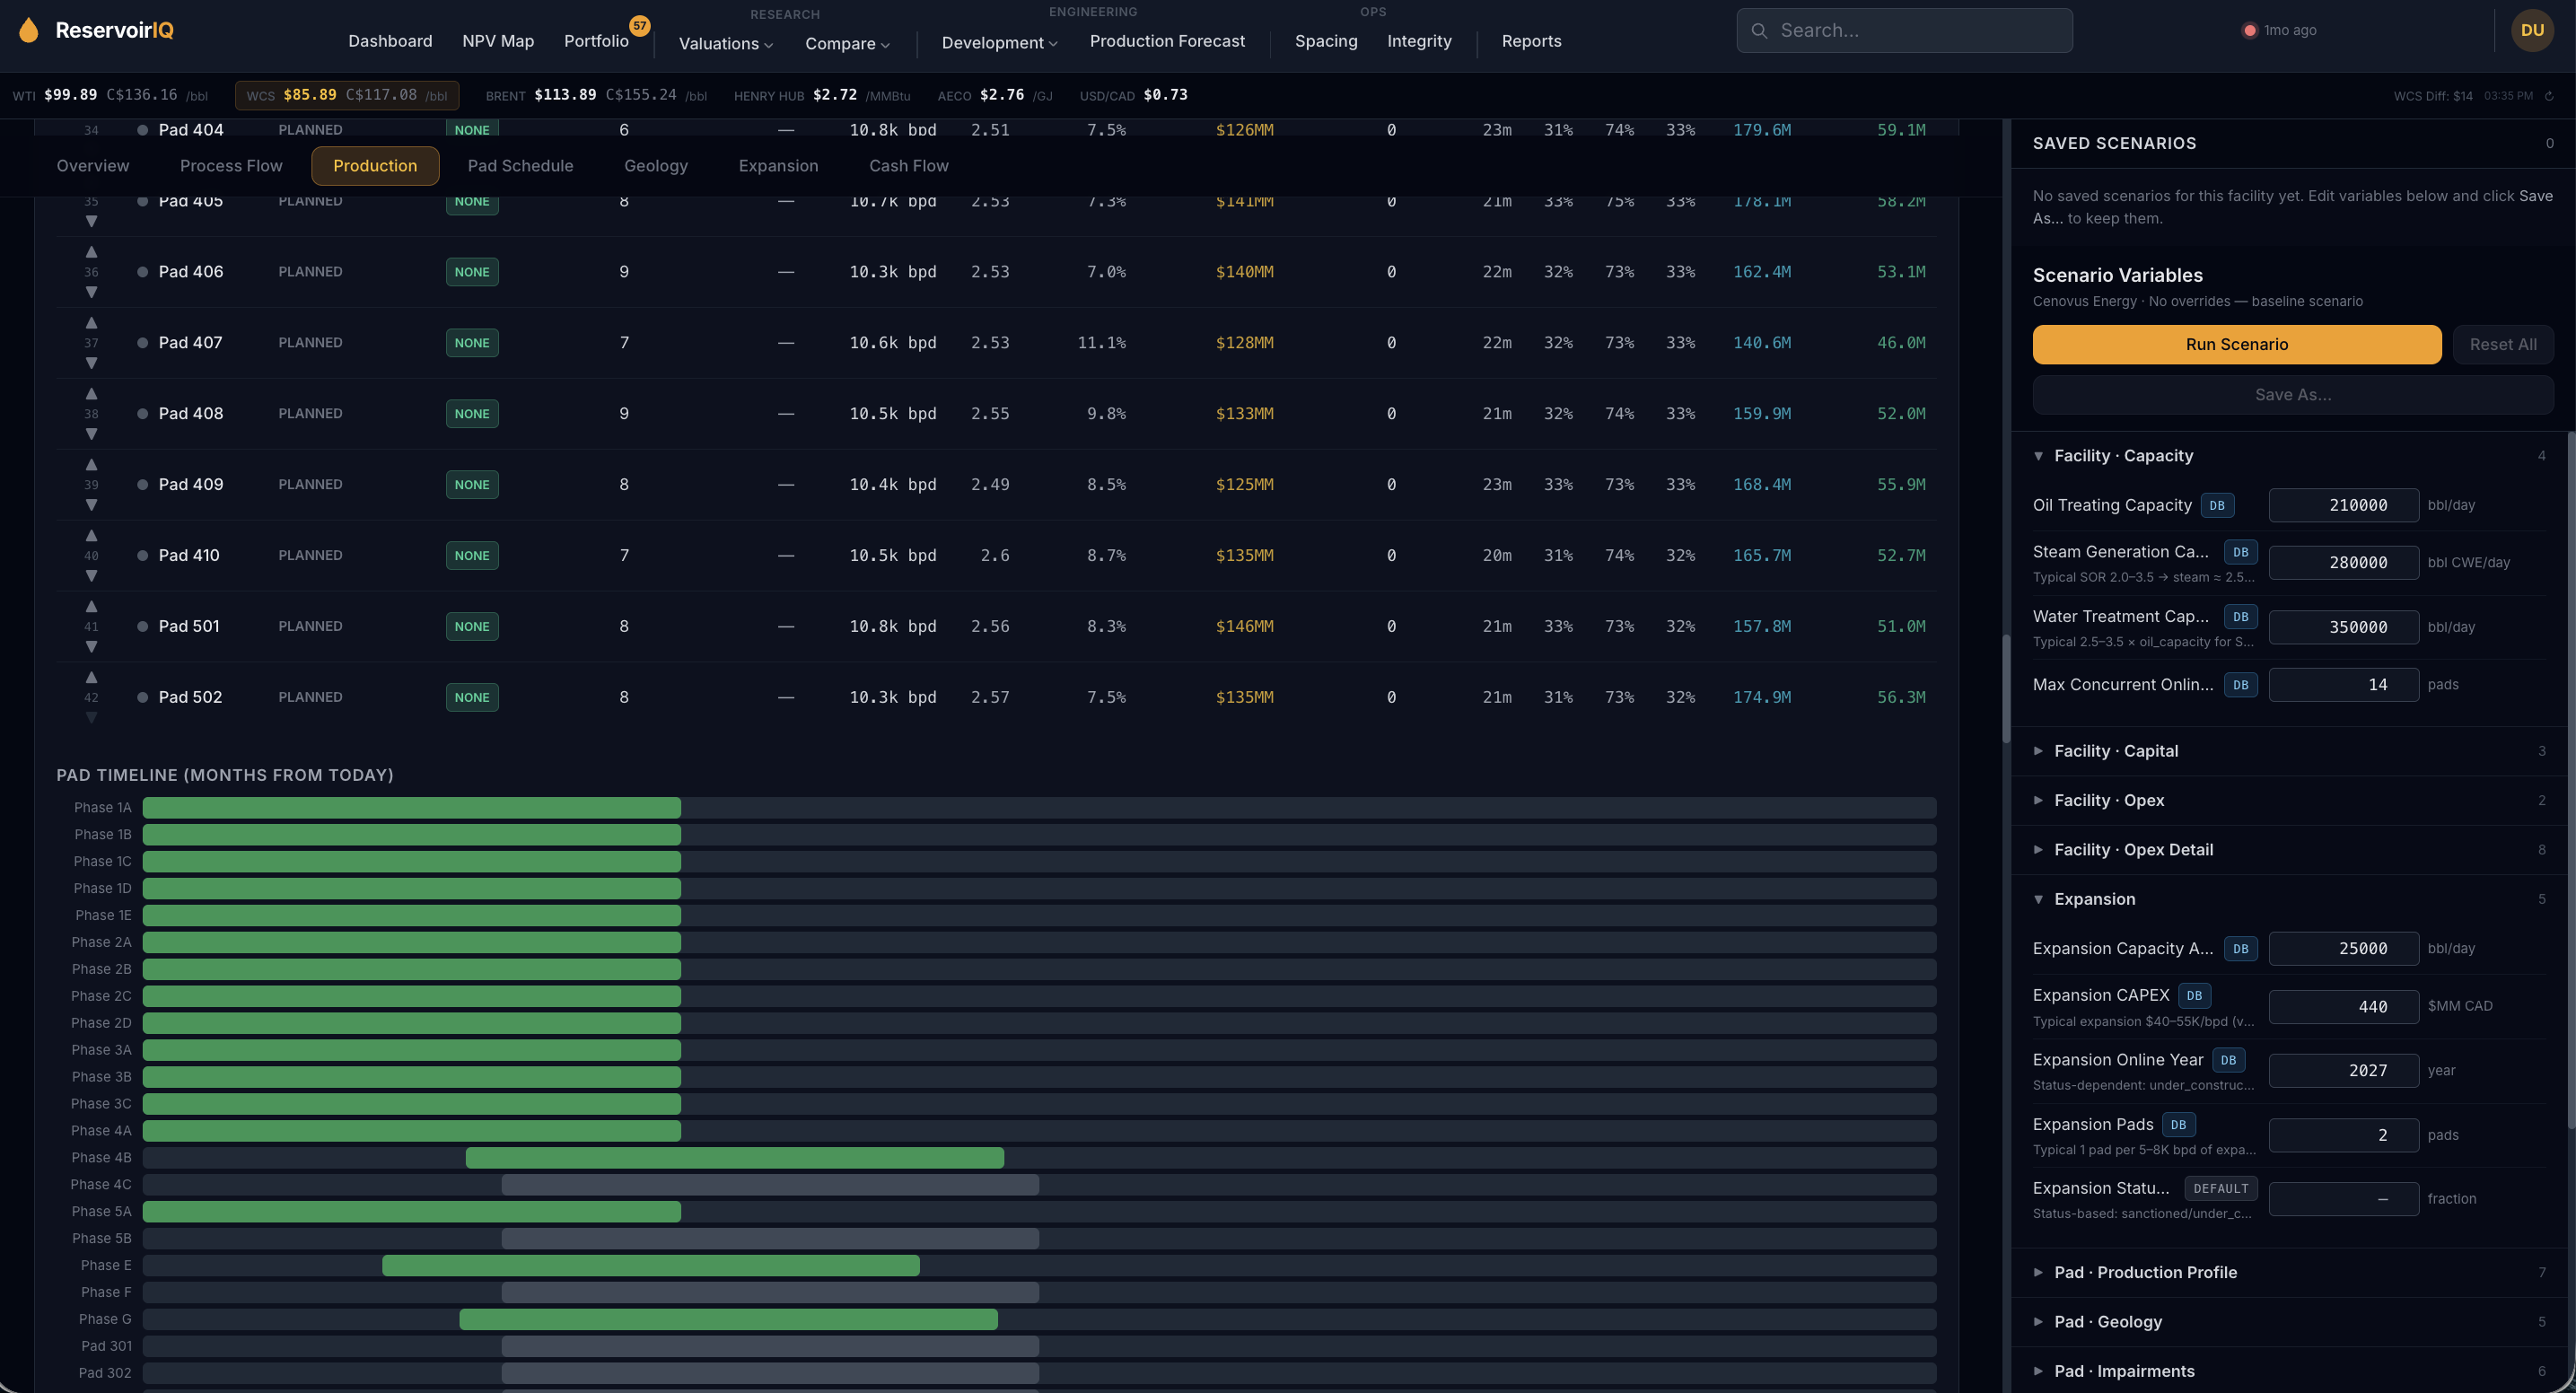
Pad-by-pad scheduling for 32 thermal facilities with geology-aware steam-oil-ratio derivation. Reservoir impairments quantified as SOR penalty, peak rate reduction, and ramp delay (lean zones, IHS, shale barriers, thief zones, top gas, top water). Fifty-year DCF honoring AER-approved long-life horizons (Kearl 2070, Fort Hills 2066, Scotford 60-year).
Three named price decks: a conservative reserve-evaluator deck, a 5-source blend, and a bull-case deck. Two named fiscal regimes: current Modernized Royalty Framework, and a hypothetical high-royalty regime modeled on the 2007 Alberta Royalty Review. All values reconcile across the lens via cached alt-deck columns.
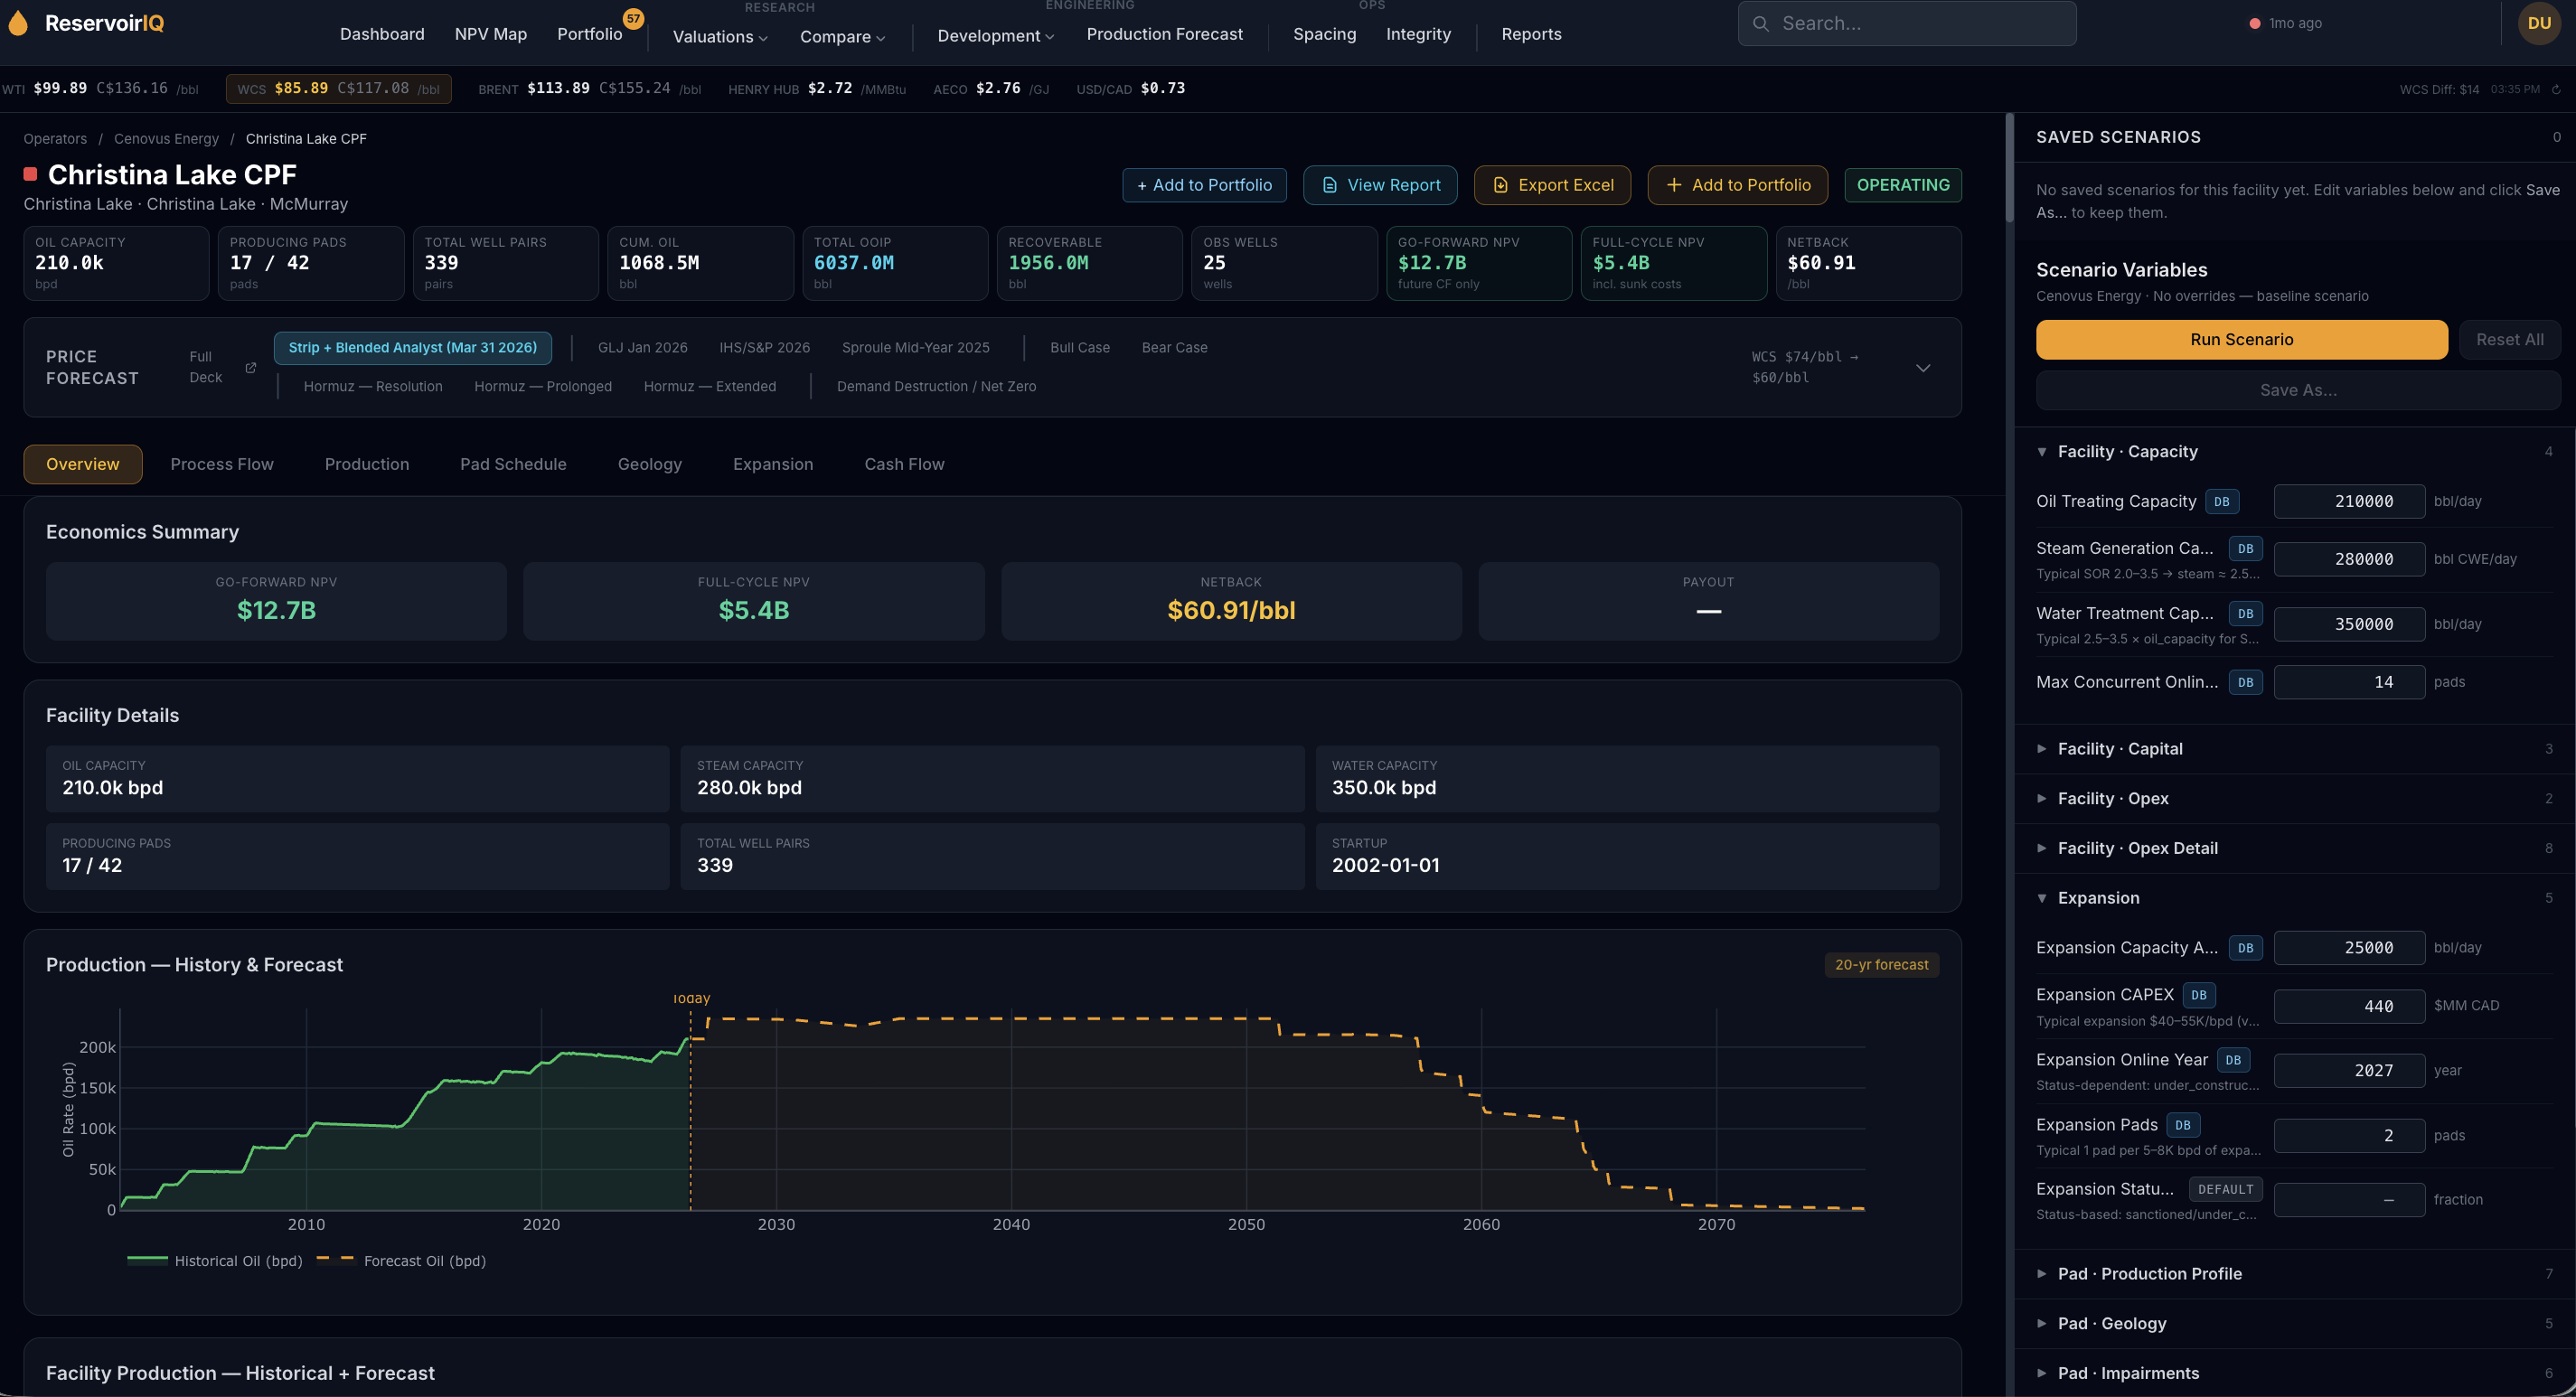
Eighty-eight editable variables across 16 categories per thermal facility. Per-pad geology, capacity, capex, opex itemization, upgrader product slate, royalty parameters. Save and load named scenarios with permalinks. A/B compare any two with diff expander.
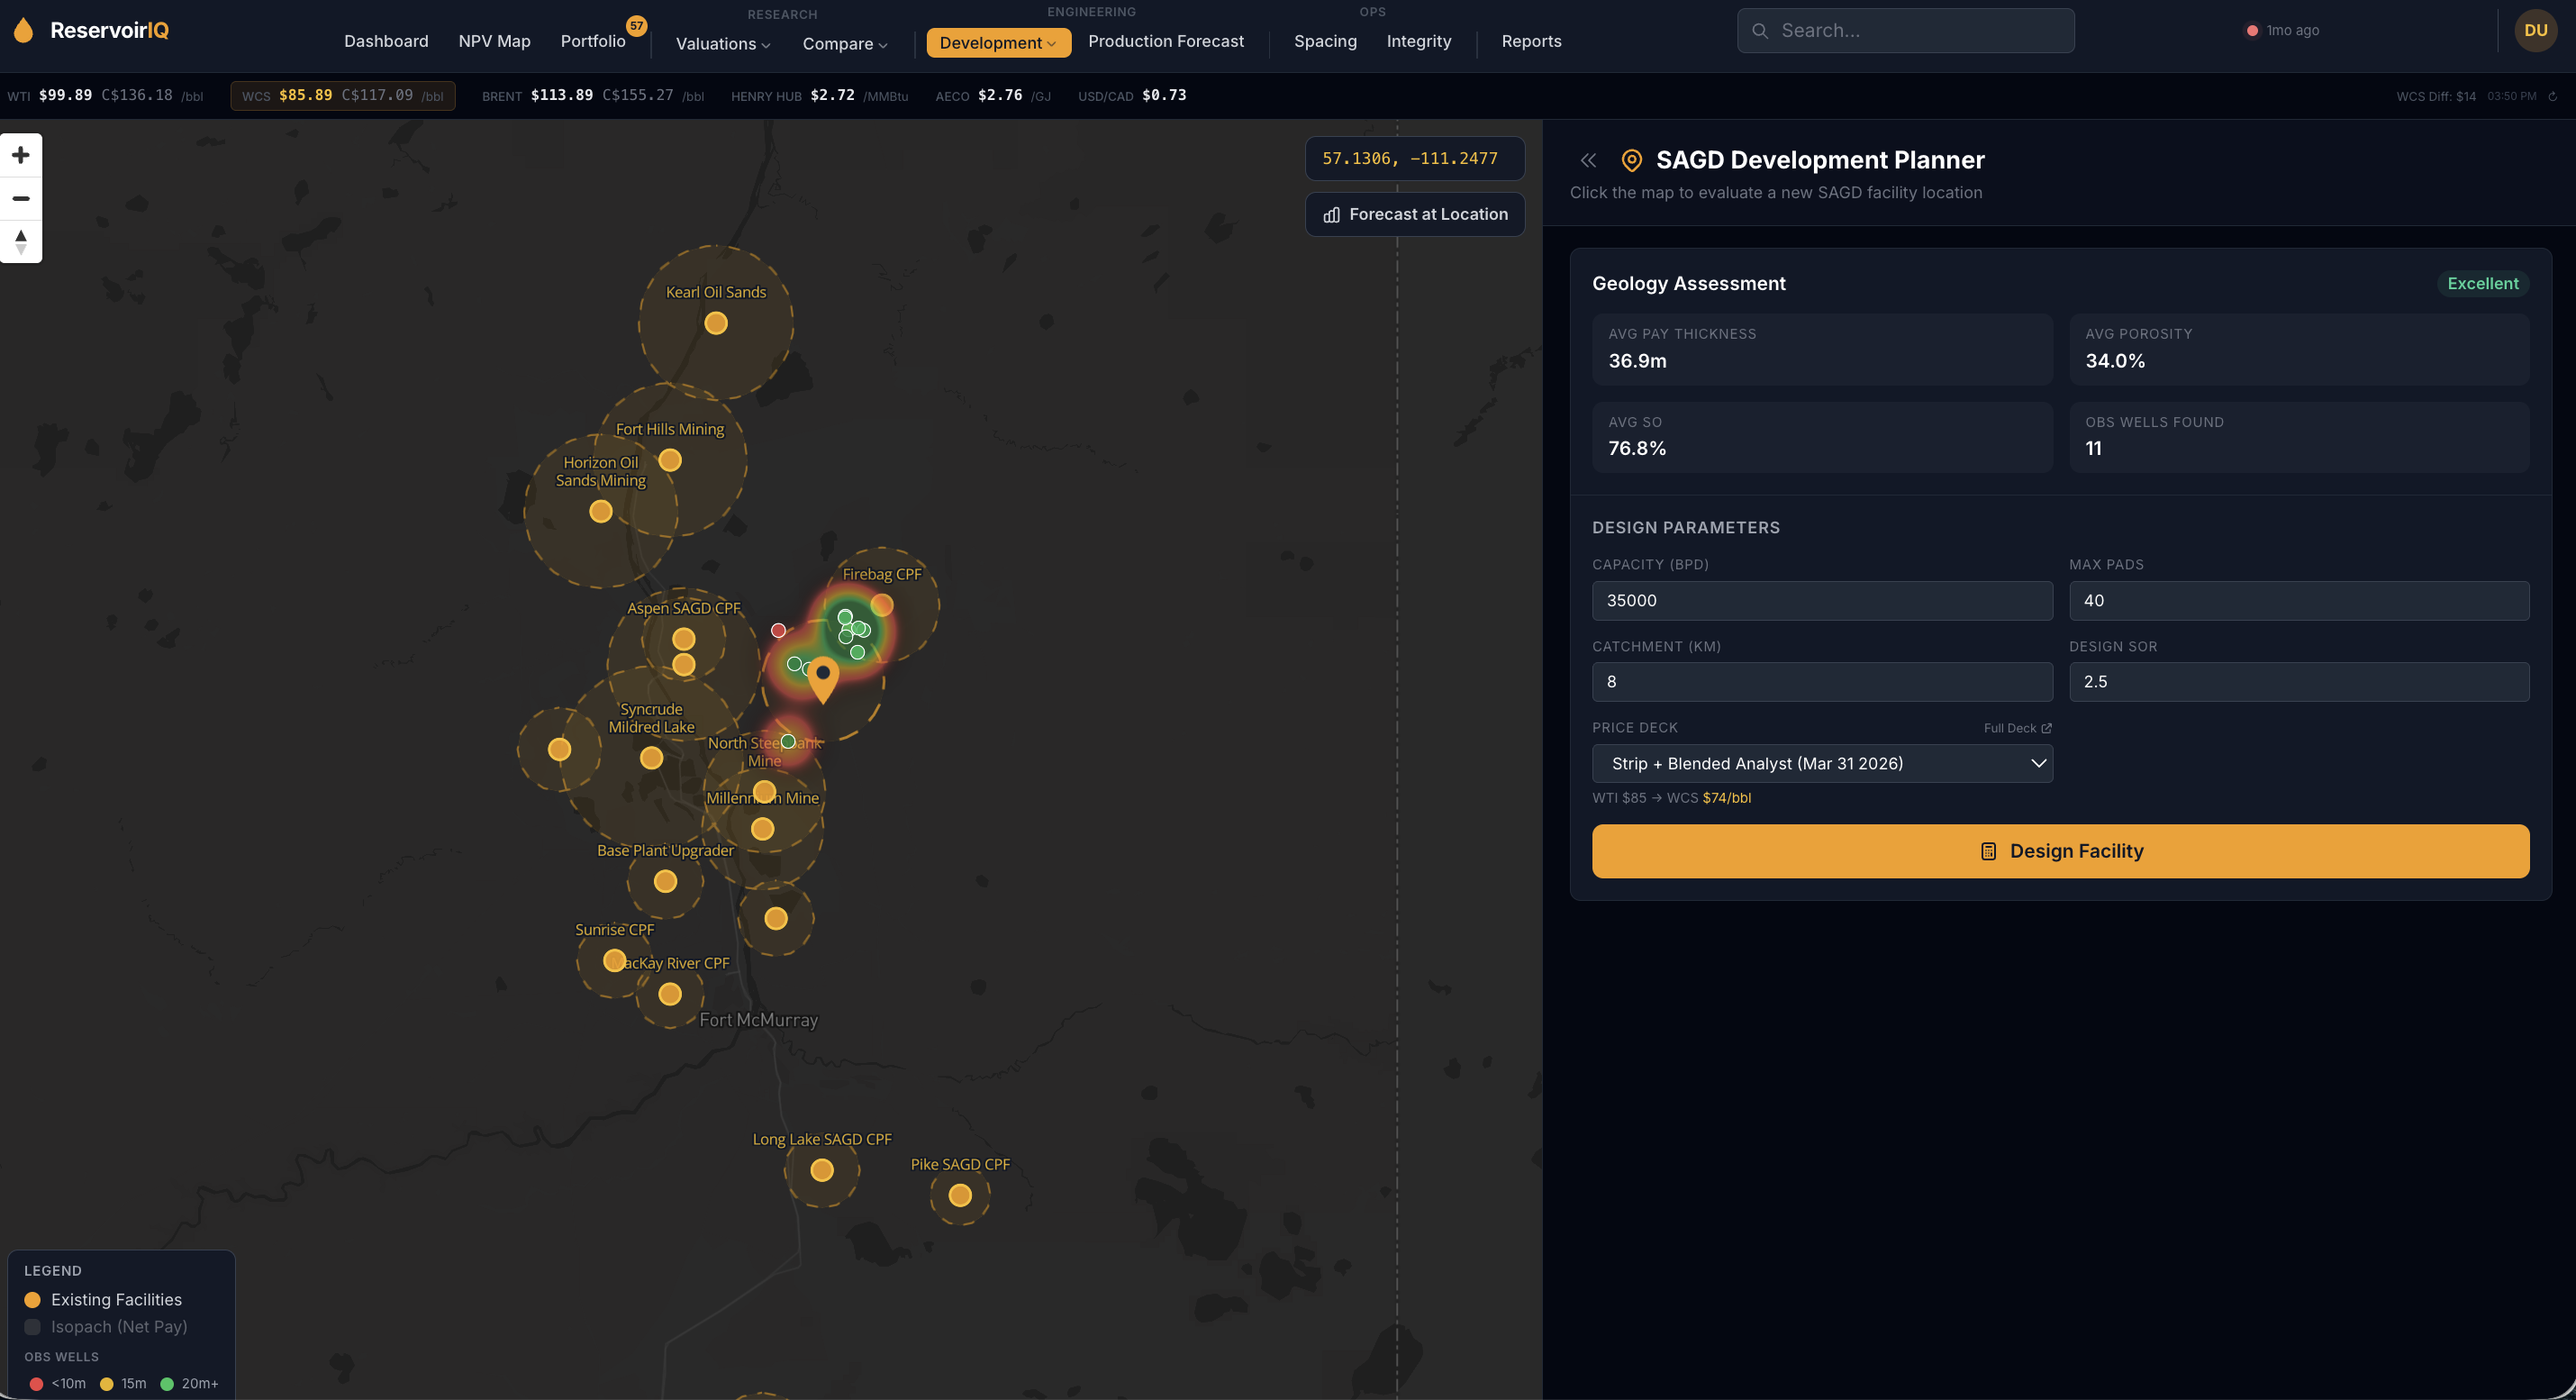
Drop a SAGD plant or midstream facility anywhere on the map. The model sources feedstock from real wellhead production within a configurable radius and runs a 40-year DCF calibrated against operating comps.
Data and methodology
Every number in ReservoirIQ is built from publicly available regulatory and operator data. Methodology is cited inline against original source.
Tour
Screenshots of the live platform, framed by what each view does for an evaluation.
1
Every conventional well, every SAGD pad, every refinery, every offshore field, modeled component by component and stacked into a defensible equity-NAV-per-share. Compared live to TSX market cap. Sub-second toggle between three price-deck lenses and two fiscal-regime scenarios.
2
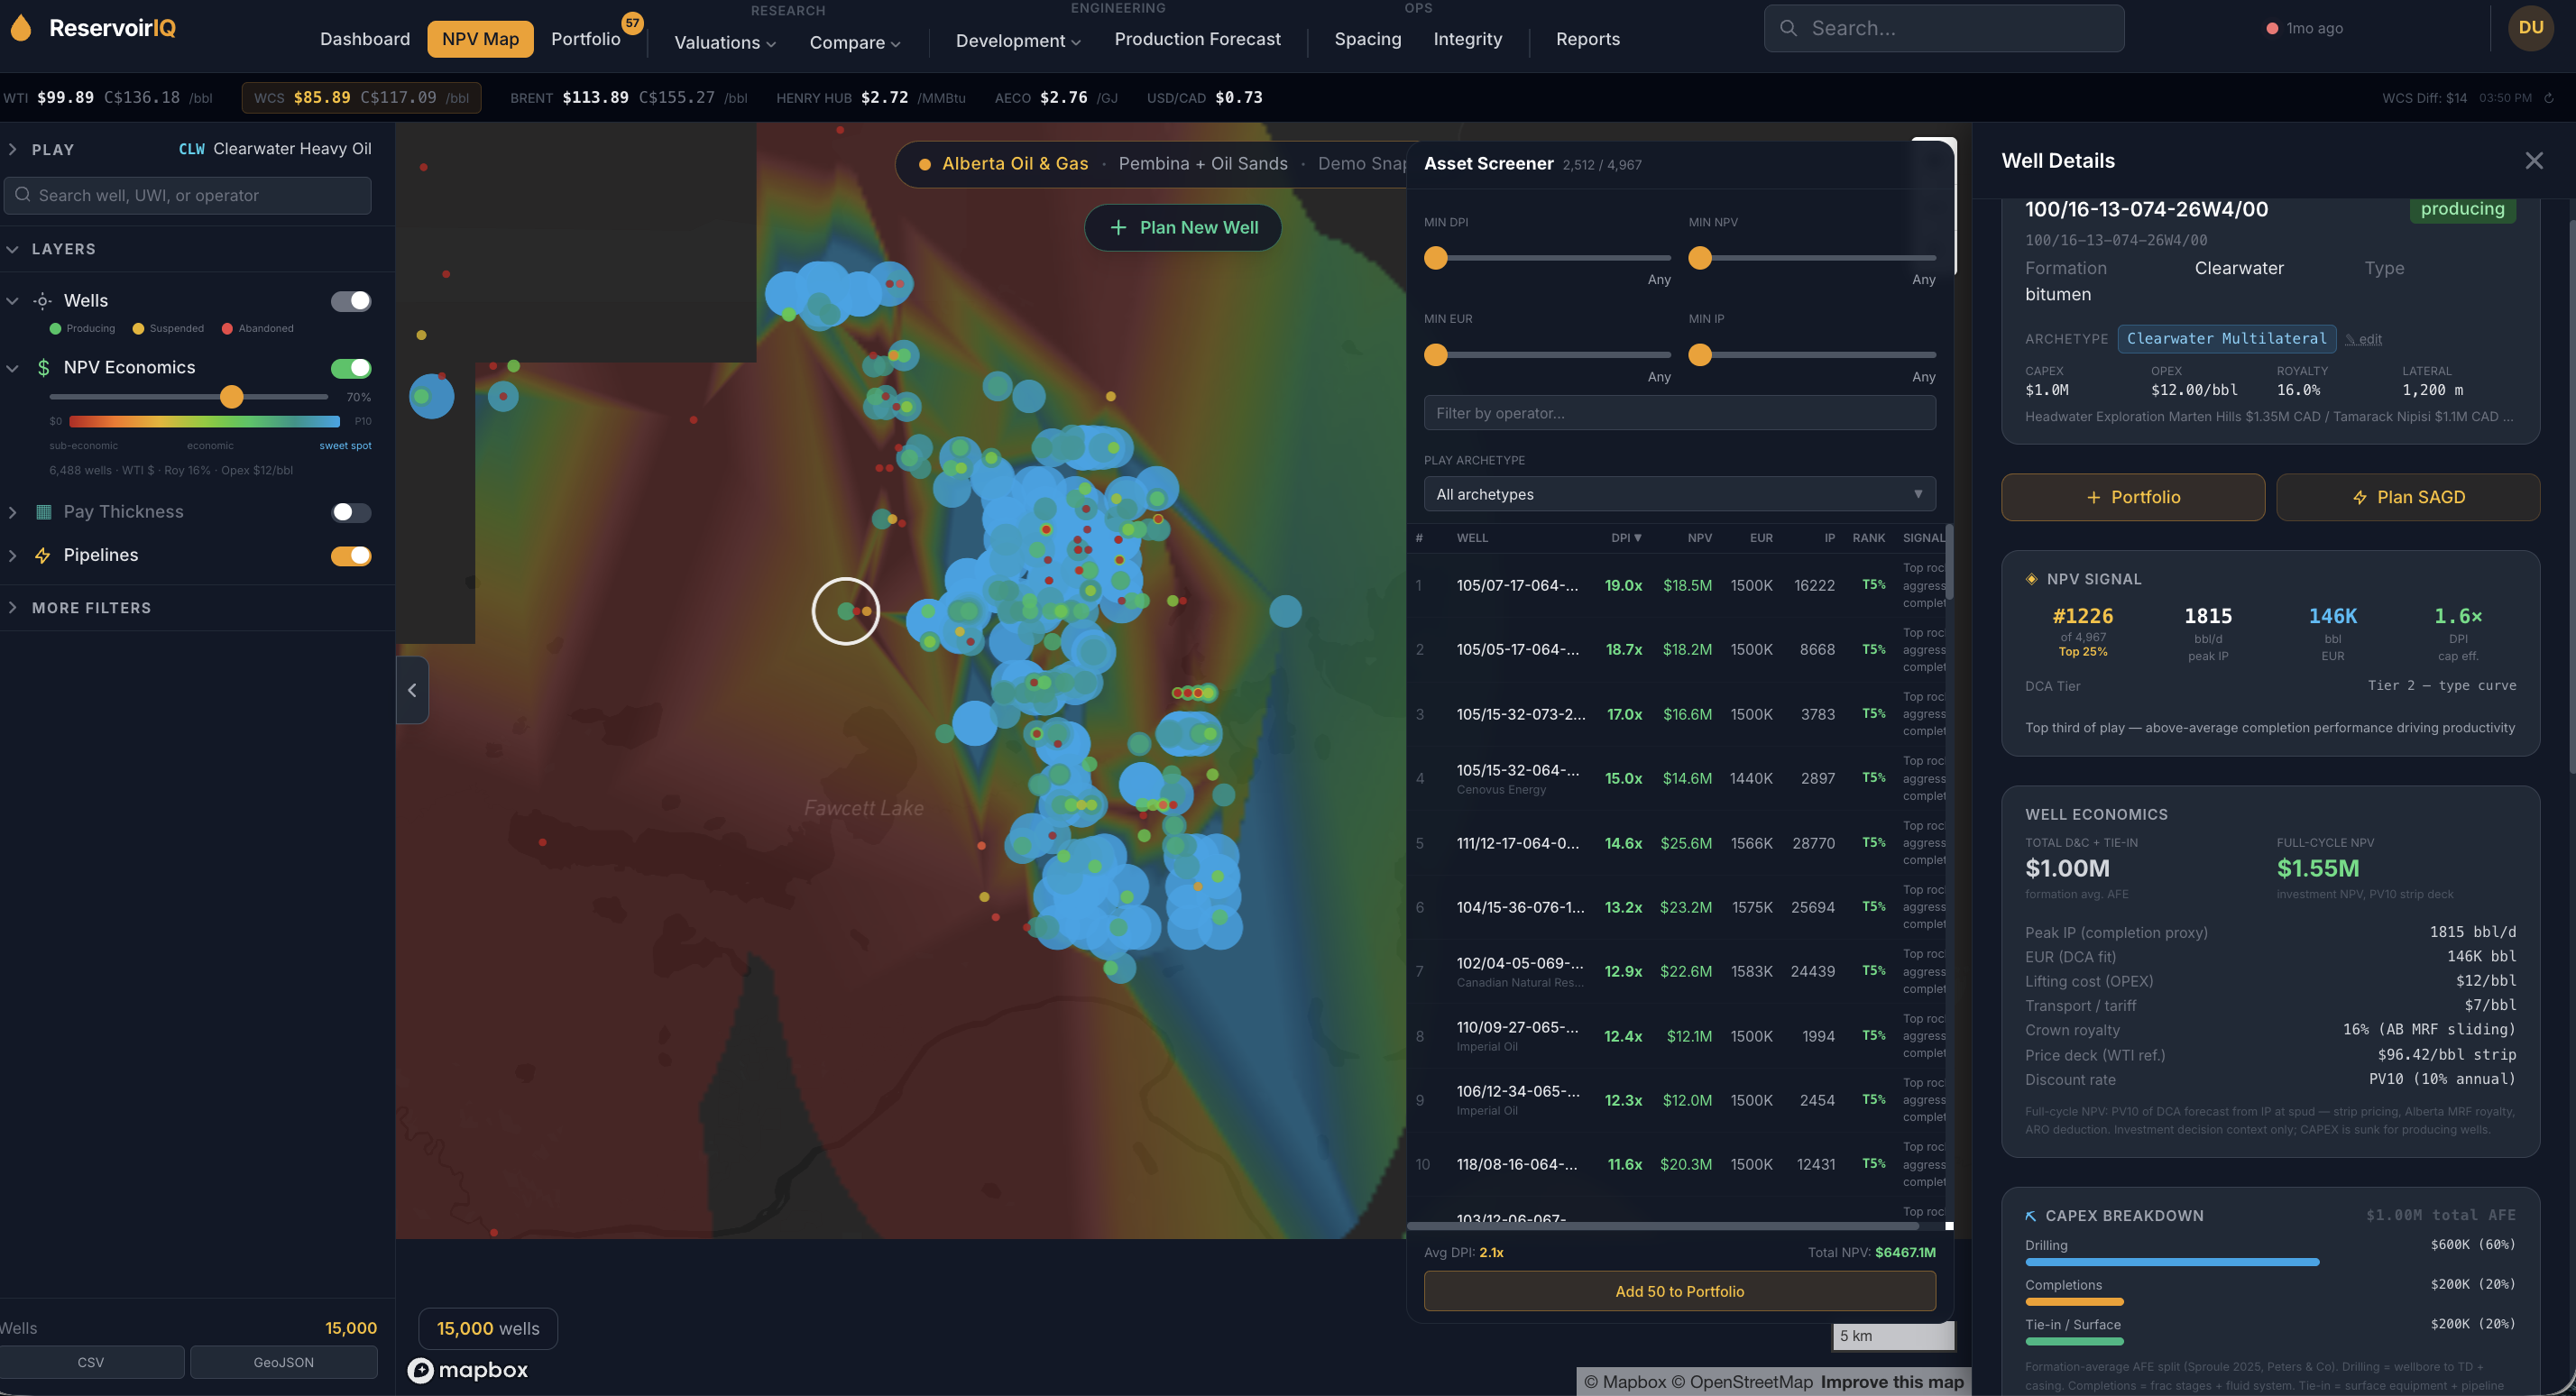
Every Alberta and Saskatchewan well on a single map with bottom-up NPV bubbles. Filter by 38 play archetypes (Kakwa liquids vs. Deep Basin dry, Clearwater multilateral vs. Bakken SK OHML), and the screener re-ranks by DPI or remaining NPV against the new filter.
3
Eighty-eight editable variables per facility (capacities, capex, opex itemization, geology per pad, upgrader product slate, royalty parameters). Save scenarios. Share via permalink. A/B compare any two with the cash-flow overlay.
4
Pad-by-pad scheduling with reservoir impairment modeling. Lean zones, IHS, shale barriers, thief zones, top gas, top water. Each impairment quantified as SOR penalty, peak rate reduction, and ramp delay. Fifty-year DCF honors AER-approved long-life horizons.
5
Drop a SAGD plant or frac/gas plant anywhere on the map. The tool sources feedstock from real wellhead production within a configurable radius and runs a 40-year DCF calibrated against operating comps.
6
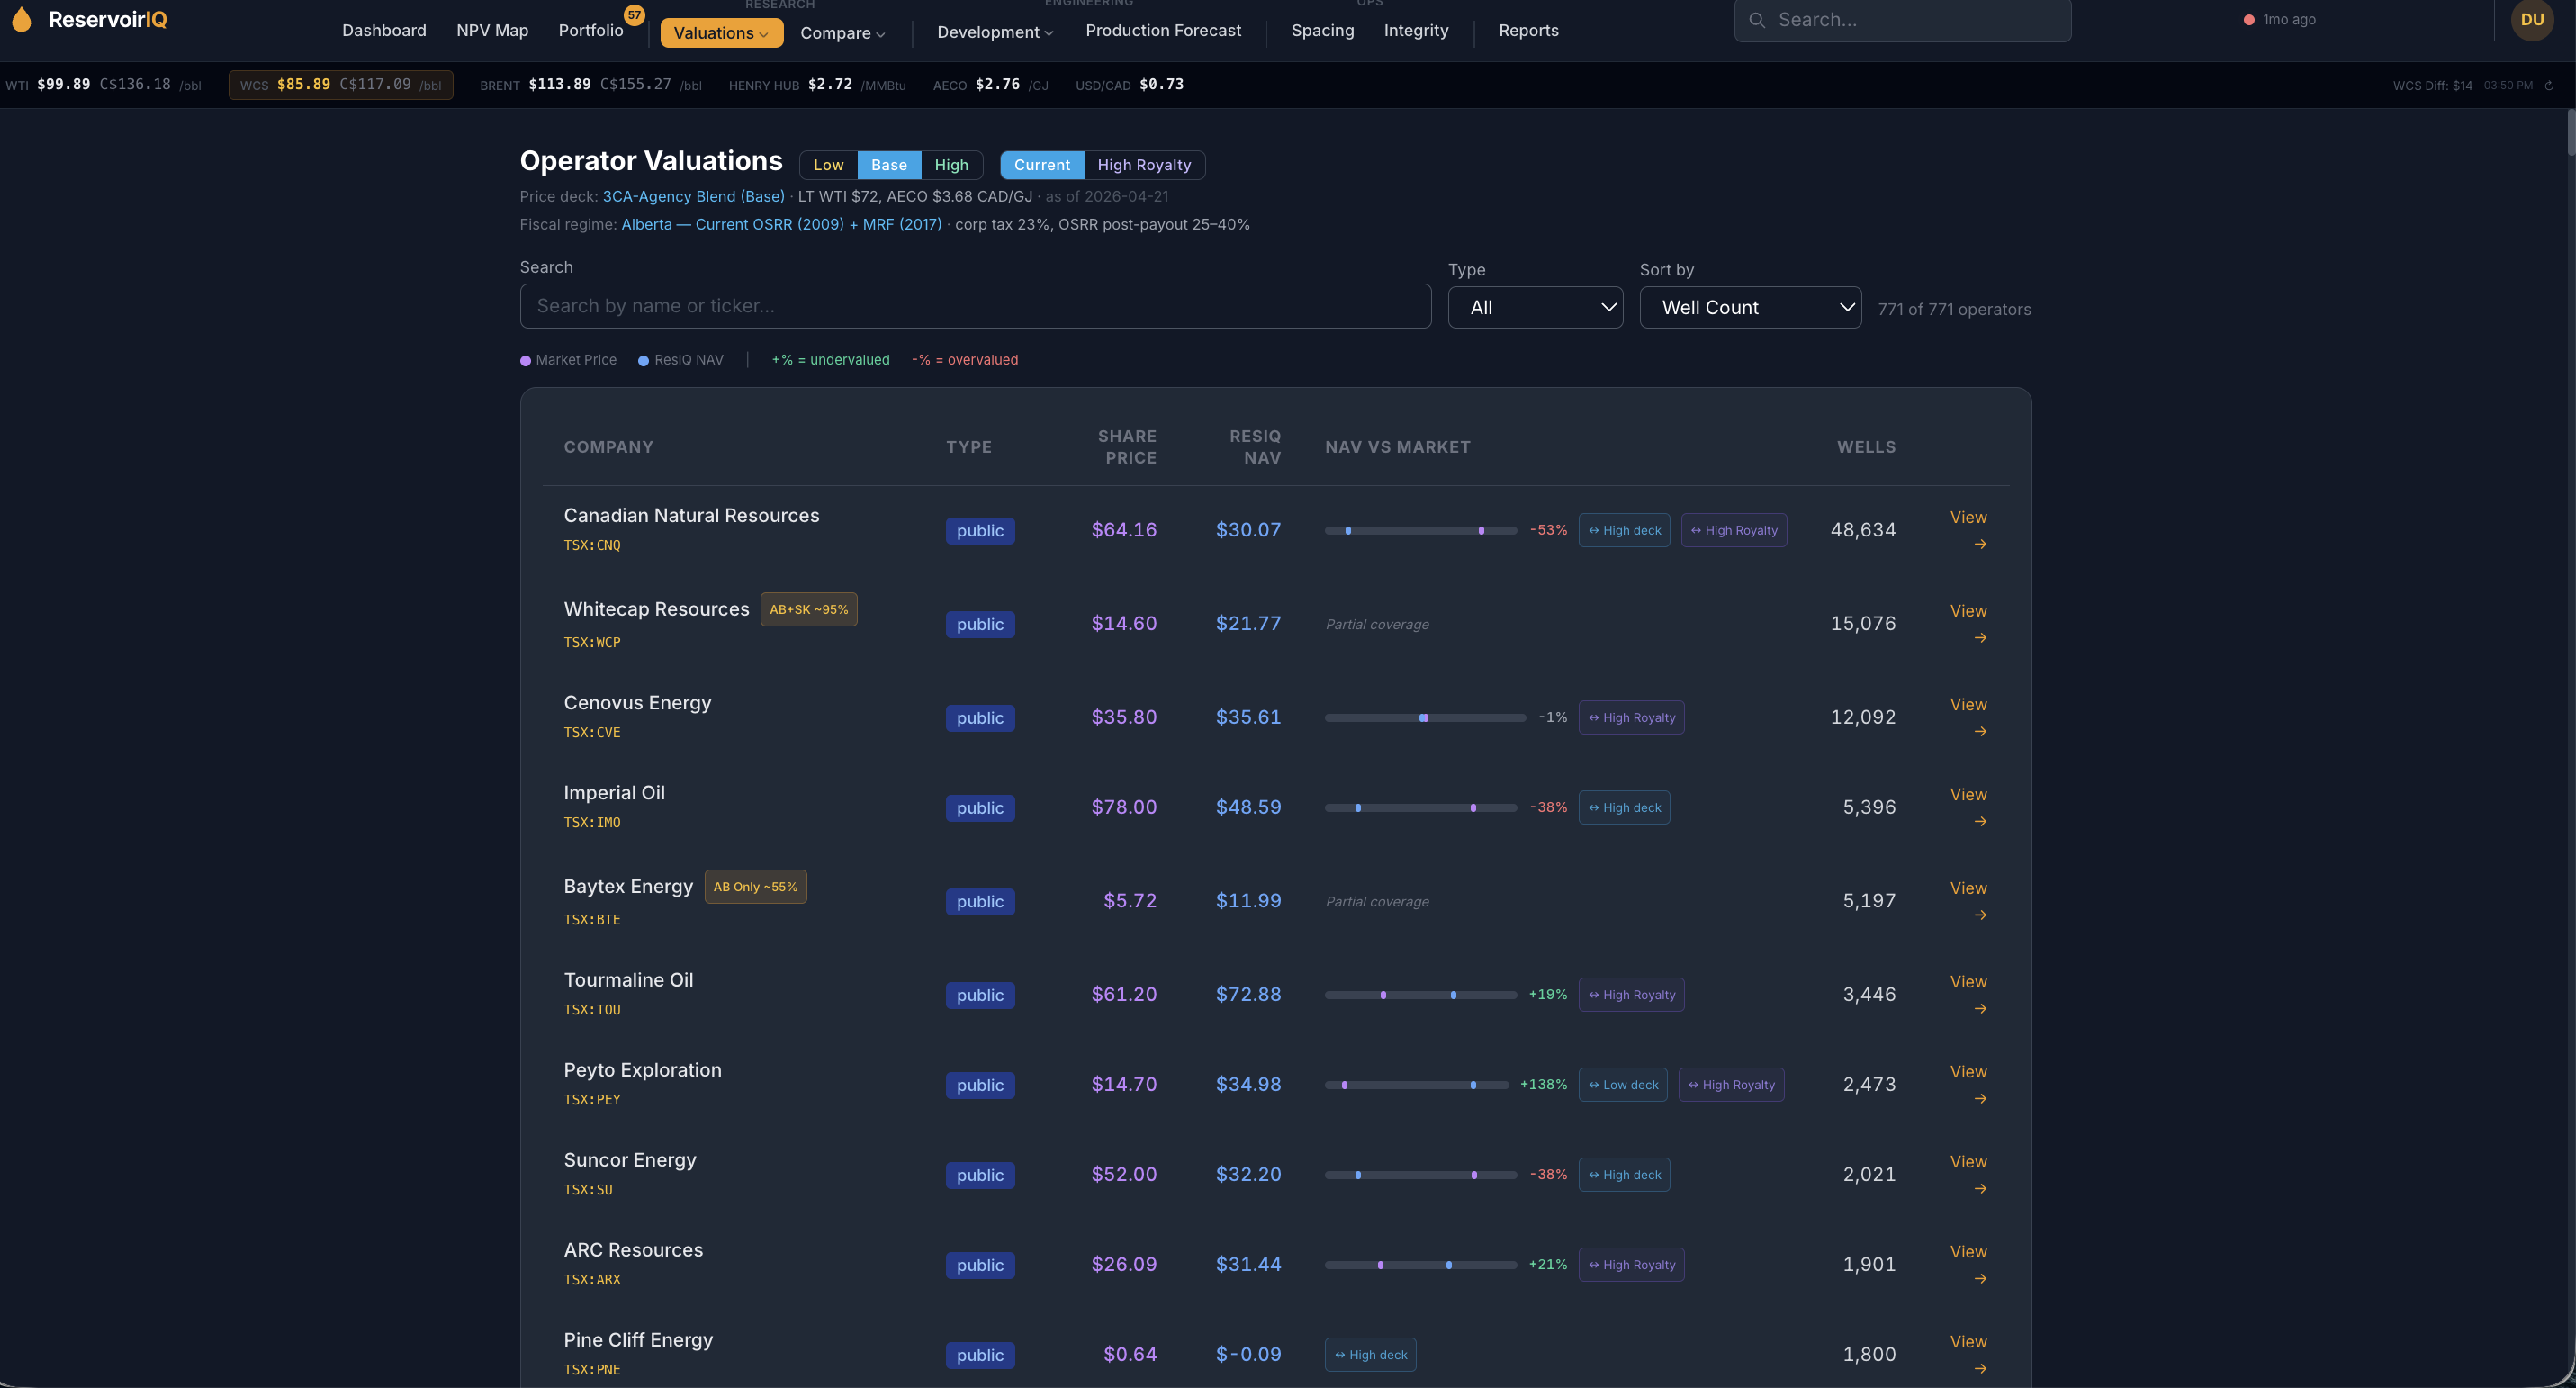
Every public Canadian E&P ranked by NAV-to-market ratio. Toggle between three published price decks (conservative, blend, bull). Operators that look mispriced under one lens often reconcile under another.
7
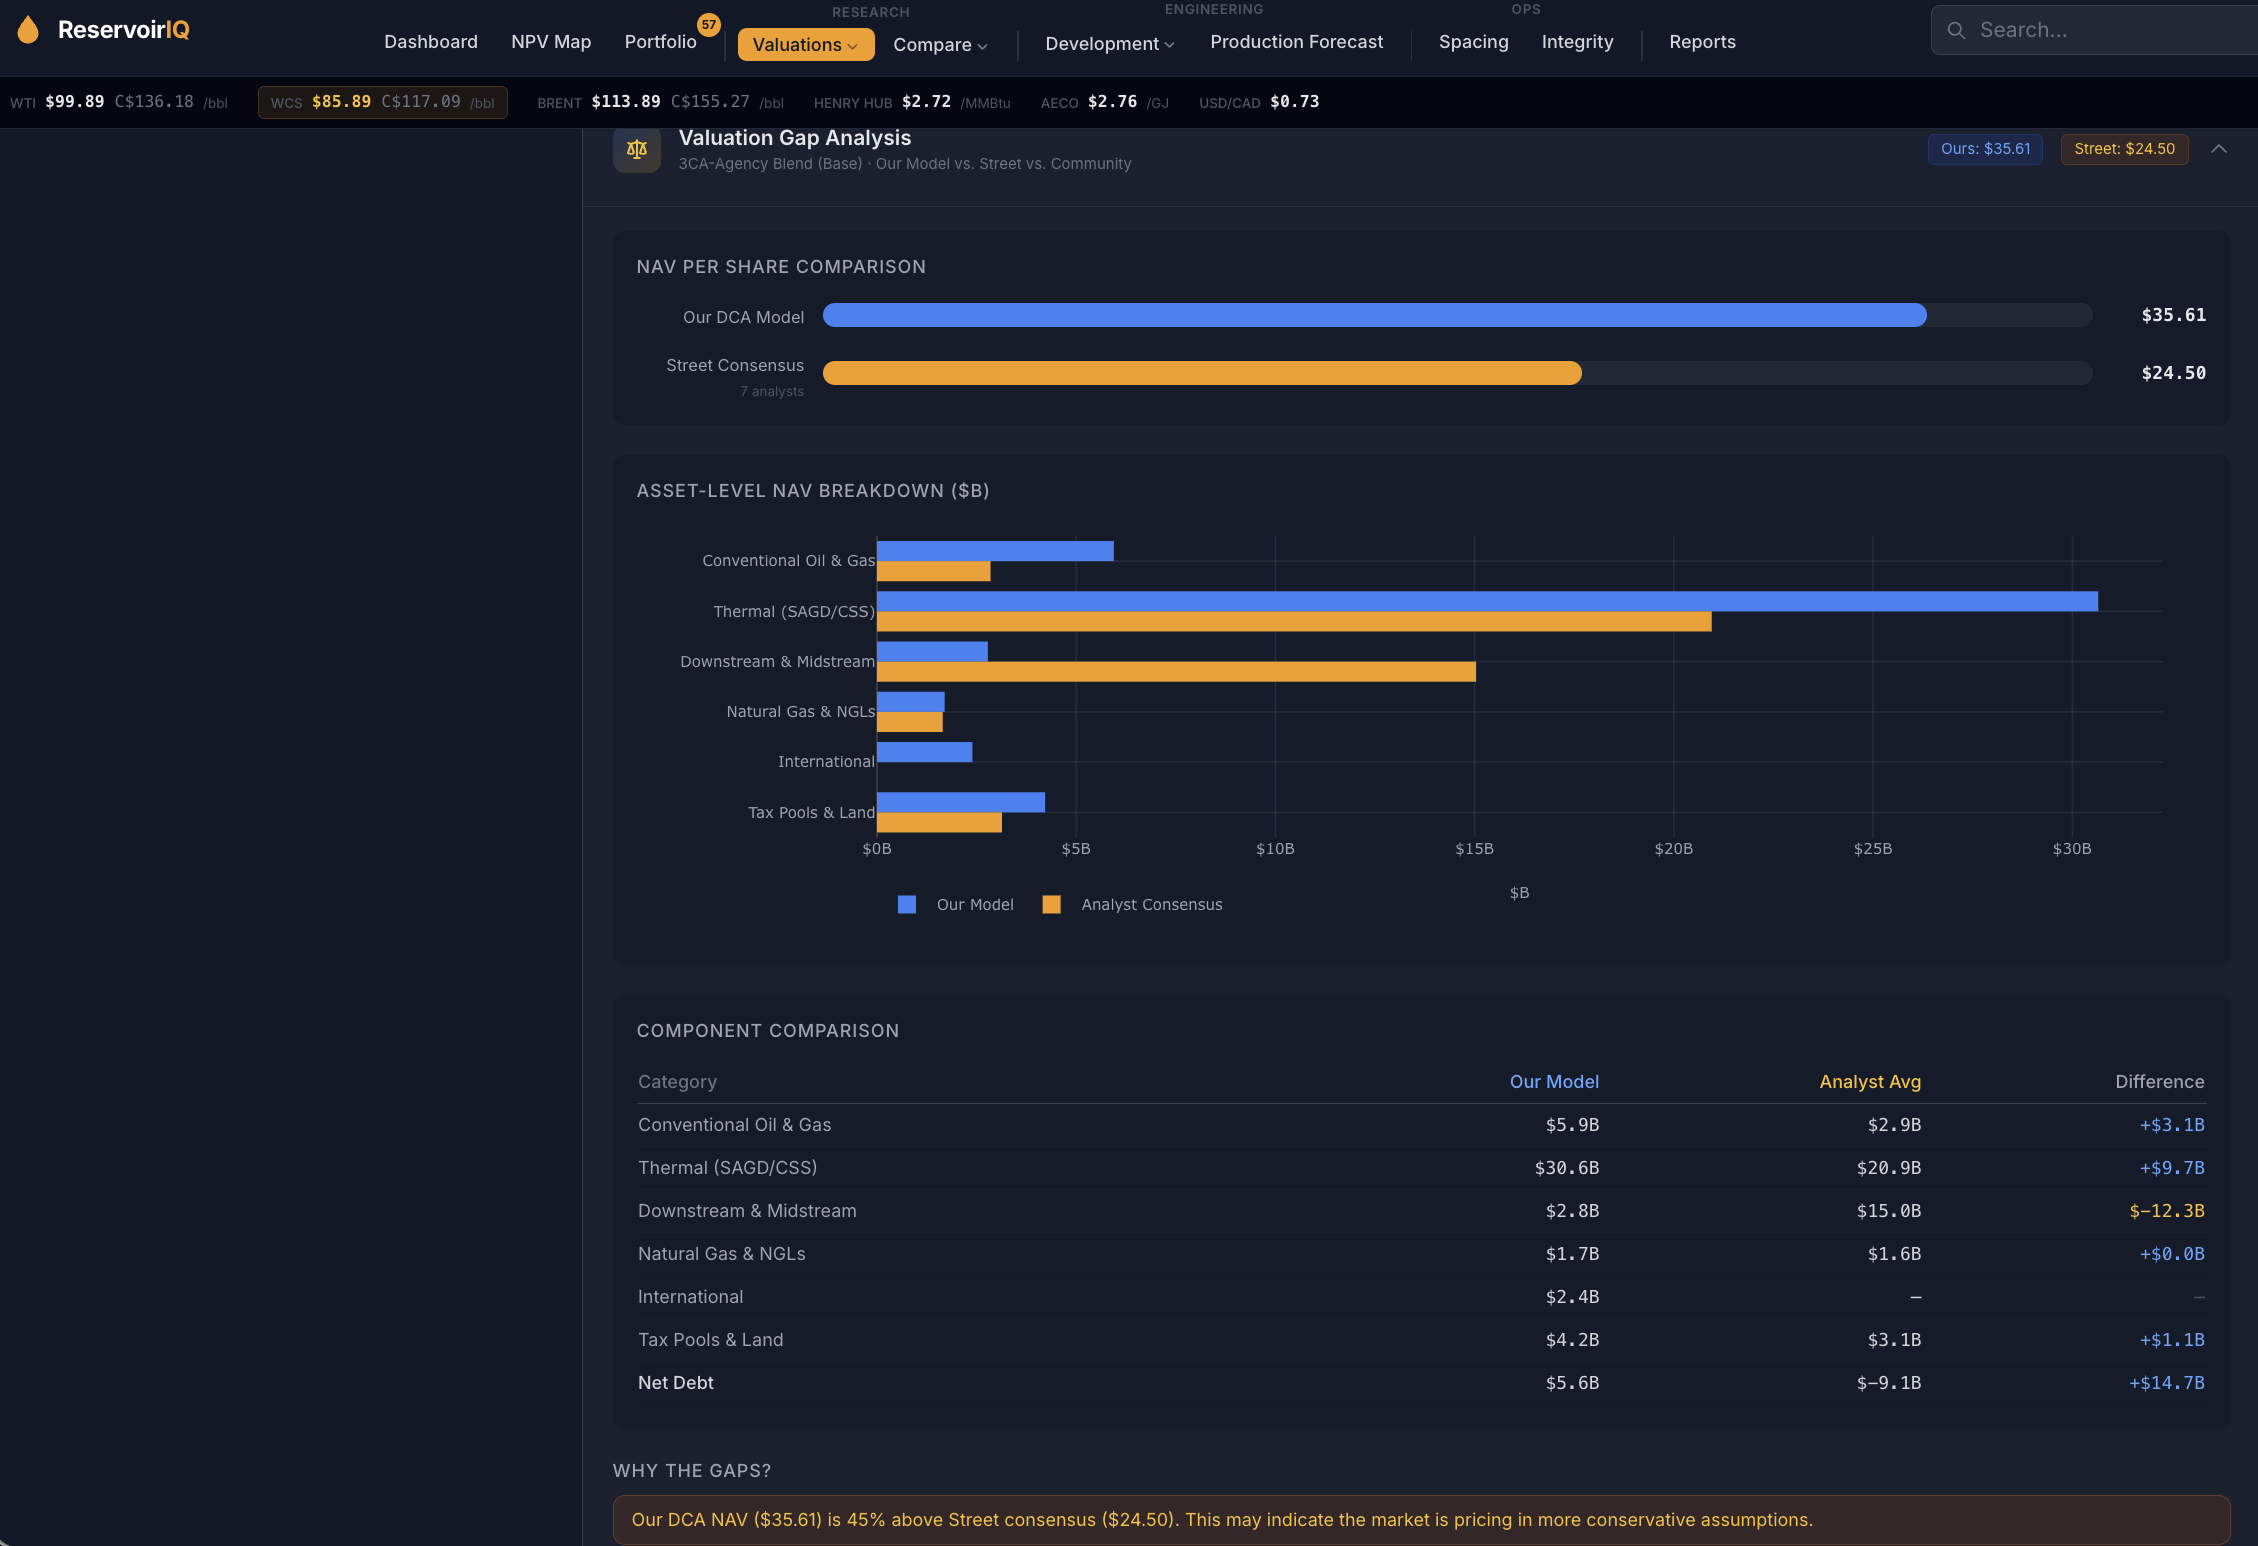
When ReservoirIQ NAV diverges from analyst consensus, the tool explains why. SAGD reserve life, mining inventory, international assets, midstream optionality, price-deck differential. Every gap has a defensible attribution.
8
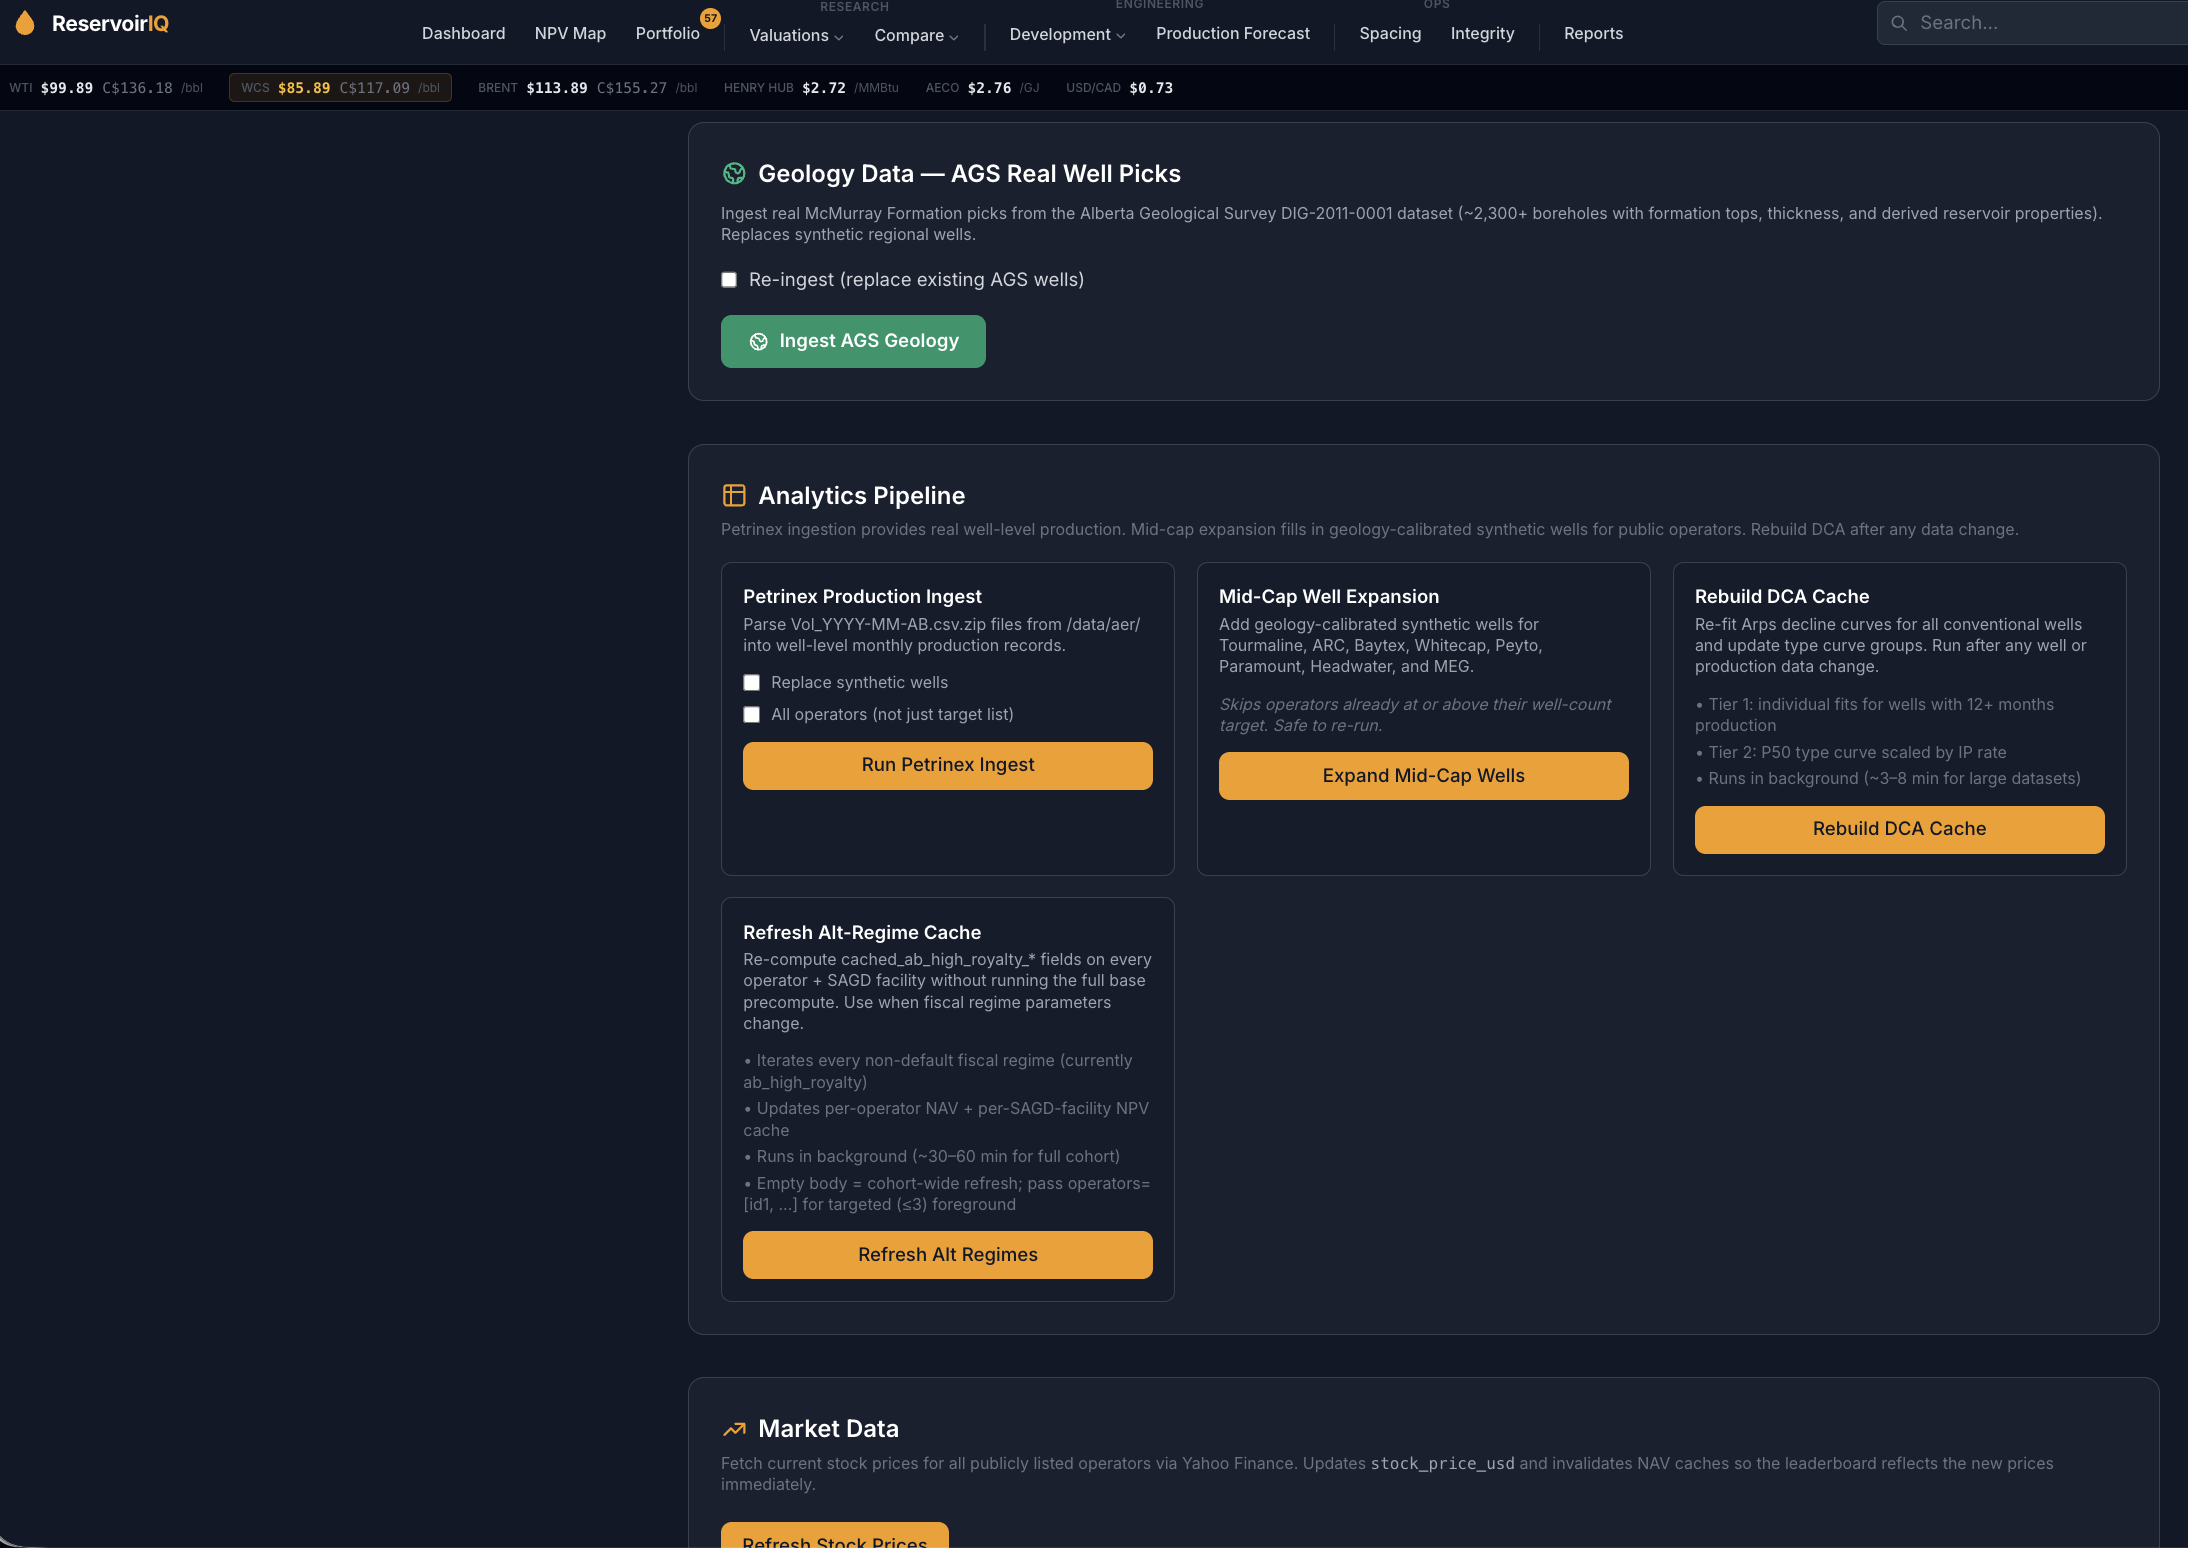
Every well's NPV is built from raw production data, through DCA fit, to economics. Rebuild any layer with one click. The tool times each phase and counts cache hits, so every layer of the model is auditable end to end.
9
Every well prices to the right hub. Heavy oil to WCS, light to MSW, condensate to C5, gas to AECO, with formation-specific transport costs. No single oil-price assumption.
Current focus
Crown and freehold mineral lease polygons with operator attribution, expiry tracking, and net acreage. Powers undeveloped land valuation and PUD inventory sizing. Currently in development for delivery against active engagement priorities.
Scope
ReservoirIQ's current coverage spans the Western Canadian Sedimentary Basin (Alberta and Saskatchewan), East Coast Canada offshore, and cross-border integrated downstream where Canadian operators have refining and upgrading capacity (Lima, Toledo, Superior, Commerce City).
In current focus: British Columbia upstream, Norway and UK North Sea offshore, US shale plays. New geographies are added against active engagement priorities, on engagement timelines.
ReservoirIQ runs as part of a Cervus engagement, not as a standalone subscription. Your team accesses the relevant operator and asset views during an active retainer. The engagement, the desk, and the platform are one offering.
Have a confidential conversation about your opportunities